This is a wrap of my Gsoc project at Sciruby where I worked on builing Matplotlib for Ruby.
At Sciruby, we came across the ambitious task of designing the next Matplotlib for Ruby and so we examined quite a few different plotting libraries and figured that if we could put together ideas from all of these libraries then we can make something really amazing.Primarily our main source of inspiration was Matplotlib. The Matplotlib Architecture is be broadly divided into three layers. The Backend, The Artist and the scripting layer.
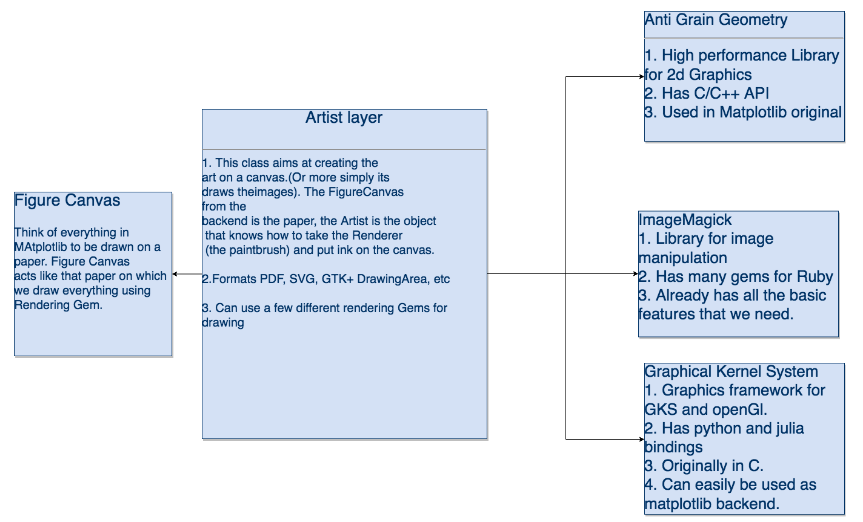
Matplotlib architecture is mostly written in Python with some of its backend (the renderer AGG and Figure canvas ) written in C++ ( The original AGG backend and helper scripts, which is quite tightly bound to python). But recently the backends are also written in Python using the renderers which have Python APIs. The finer details of the Architecture can be found here.
Based on Matplotlib our initial plans for the library can be described in this visual.
We decided to build two different ruby libraries independently but with many parallels in their code. Eventually when the project gets completed we will combine them into a single repository and give users the option to use either of the libraries as a backend for construction of the plots.
For the first one, Gr plot is plotting library for ruby that uses the GR framework as a backend. And for the second one, Magick plot is a plotting library that produces quality figures in a variety of hardcopy formats using RMagick as a backend.
Magickplot is an interesting library with many features similar to GRPlot but the internal implementations of both the libraries are radically different. We believe that depending on the use cases the users can find either of them more useful than the other one. So our next goal is to merge them together and give users a simple API to switch back ends easily from GR Plot to Magick Plot….
My work in particular dealt with building Magickplot. The library works in similar thought process to painting where you can give it an empty paper called figure canvas and then you draw upon the figure canvas using plotting features. For all drawing and plotting purposes in this library we use RMagick.
So where are our paint brushes and paints for drawing on the plot?
- draw->rectangle
- draw->circle
- draw->line
- draw->annotate
These base features will let you make Bar, Scatter, Dot, Line and Bubble plots with Magickplot with very accurate geometry. A better walk through of the construction of a single plot with this library can be found in this blog.
Application
My GSoC 2018 application for the project can be found here.
Blog Posts
The entire work for Rubyplot can be summarized in these series of blogposts:
Future Work
Our ultimate goal is to make this project similar to a matplotlib equivalent for Ruby with tons of really amazing customization features. I hope you find this interesting and useful.The library is currently being developed by the Sciruby community, feel free to try it out from github. Any suggestions and recommendations are welcome.
FOSS
I have been an active contributor to a few open source projects and I have started a few nice ones of my own and I feel really glad to have been introduced to the open source community. I really appreciate the effort by Google Open Source Committee for conducting GSoC every year. It is the best platform for aspiring programmers to improve their skill and give back to society by developing free and open source software.
Acknowledgements
Thanks to all my Mentors from Sciruby namely, Sameer Deshmukh, Pjotr Prins, Prasun Anand and John Woods. Special thanks to Pranav Garg a fellow GSoCer who is the lead developer of GR-Ruby and a student in Gsoc for Sciruby