Introduction
This summer I’ve been participating in Google Summer of Code with GnuplotRB project (plotting tool for Ruby users based on Gnuplot) for SciRuby. GSoC is almost over and I’m releasing v0.3.1 of GnuplotRB as a gem. In this blog post I want to introduce the gem and highlight some of its capabilities.
Features
There are several existing plotting tools for Ruby such as Nyaplot, Plotrb, Rubyvis and Gnuplot gem. However they are not designed for large datasets and have fewer plotting styles and options than Gnuplot. Gnuplot gem was developed long ago and nowadays consists mostly of hacks and does not support modern Gnuplot features such as multiplot.
Therefore my goal was to develop new gem for Gnuplot which would allow full use of its features in Ruby. I was inspired to build an easy-to-use interface for the most commonly used features of Gnuplot and allow users to customize their plots with Gnuplot options as easily as possible in Rubyesque way.
2D and 3D plots
The main feature of every plotting tool is its ability to plot graphs. GnuplotRB allows you
to plot both mathematical formula and (huge) sets of data. GnuplotRB supports plotting
2D graphs (GnuplotRB::Plot class) in Cartesian/parametric/polar coordinates and 3D
graphs (GnuplotRB::Splot class) — in Cartesian/cylindrical/spherical coordinates.
There are vast of plotting styles supported by GnuplotRB:
pointslineshistogramsboxerrorbarscirclesboxesfilledcurvesvectorsheatmap- etc (full list in gnuplot doc p. 47)
Plot examples:
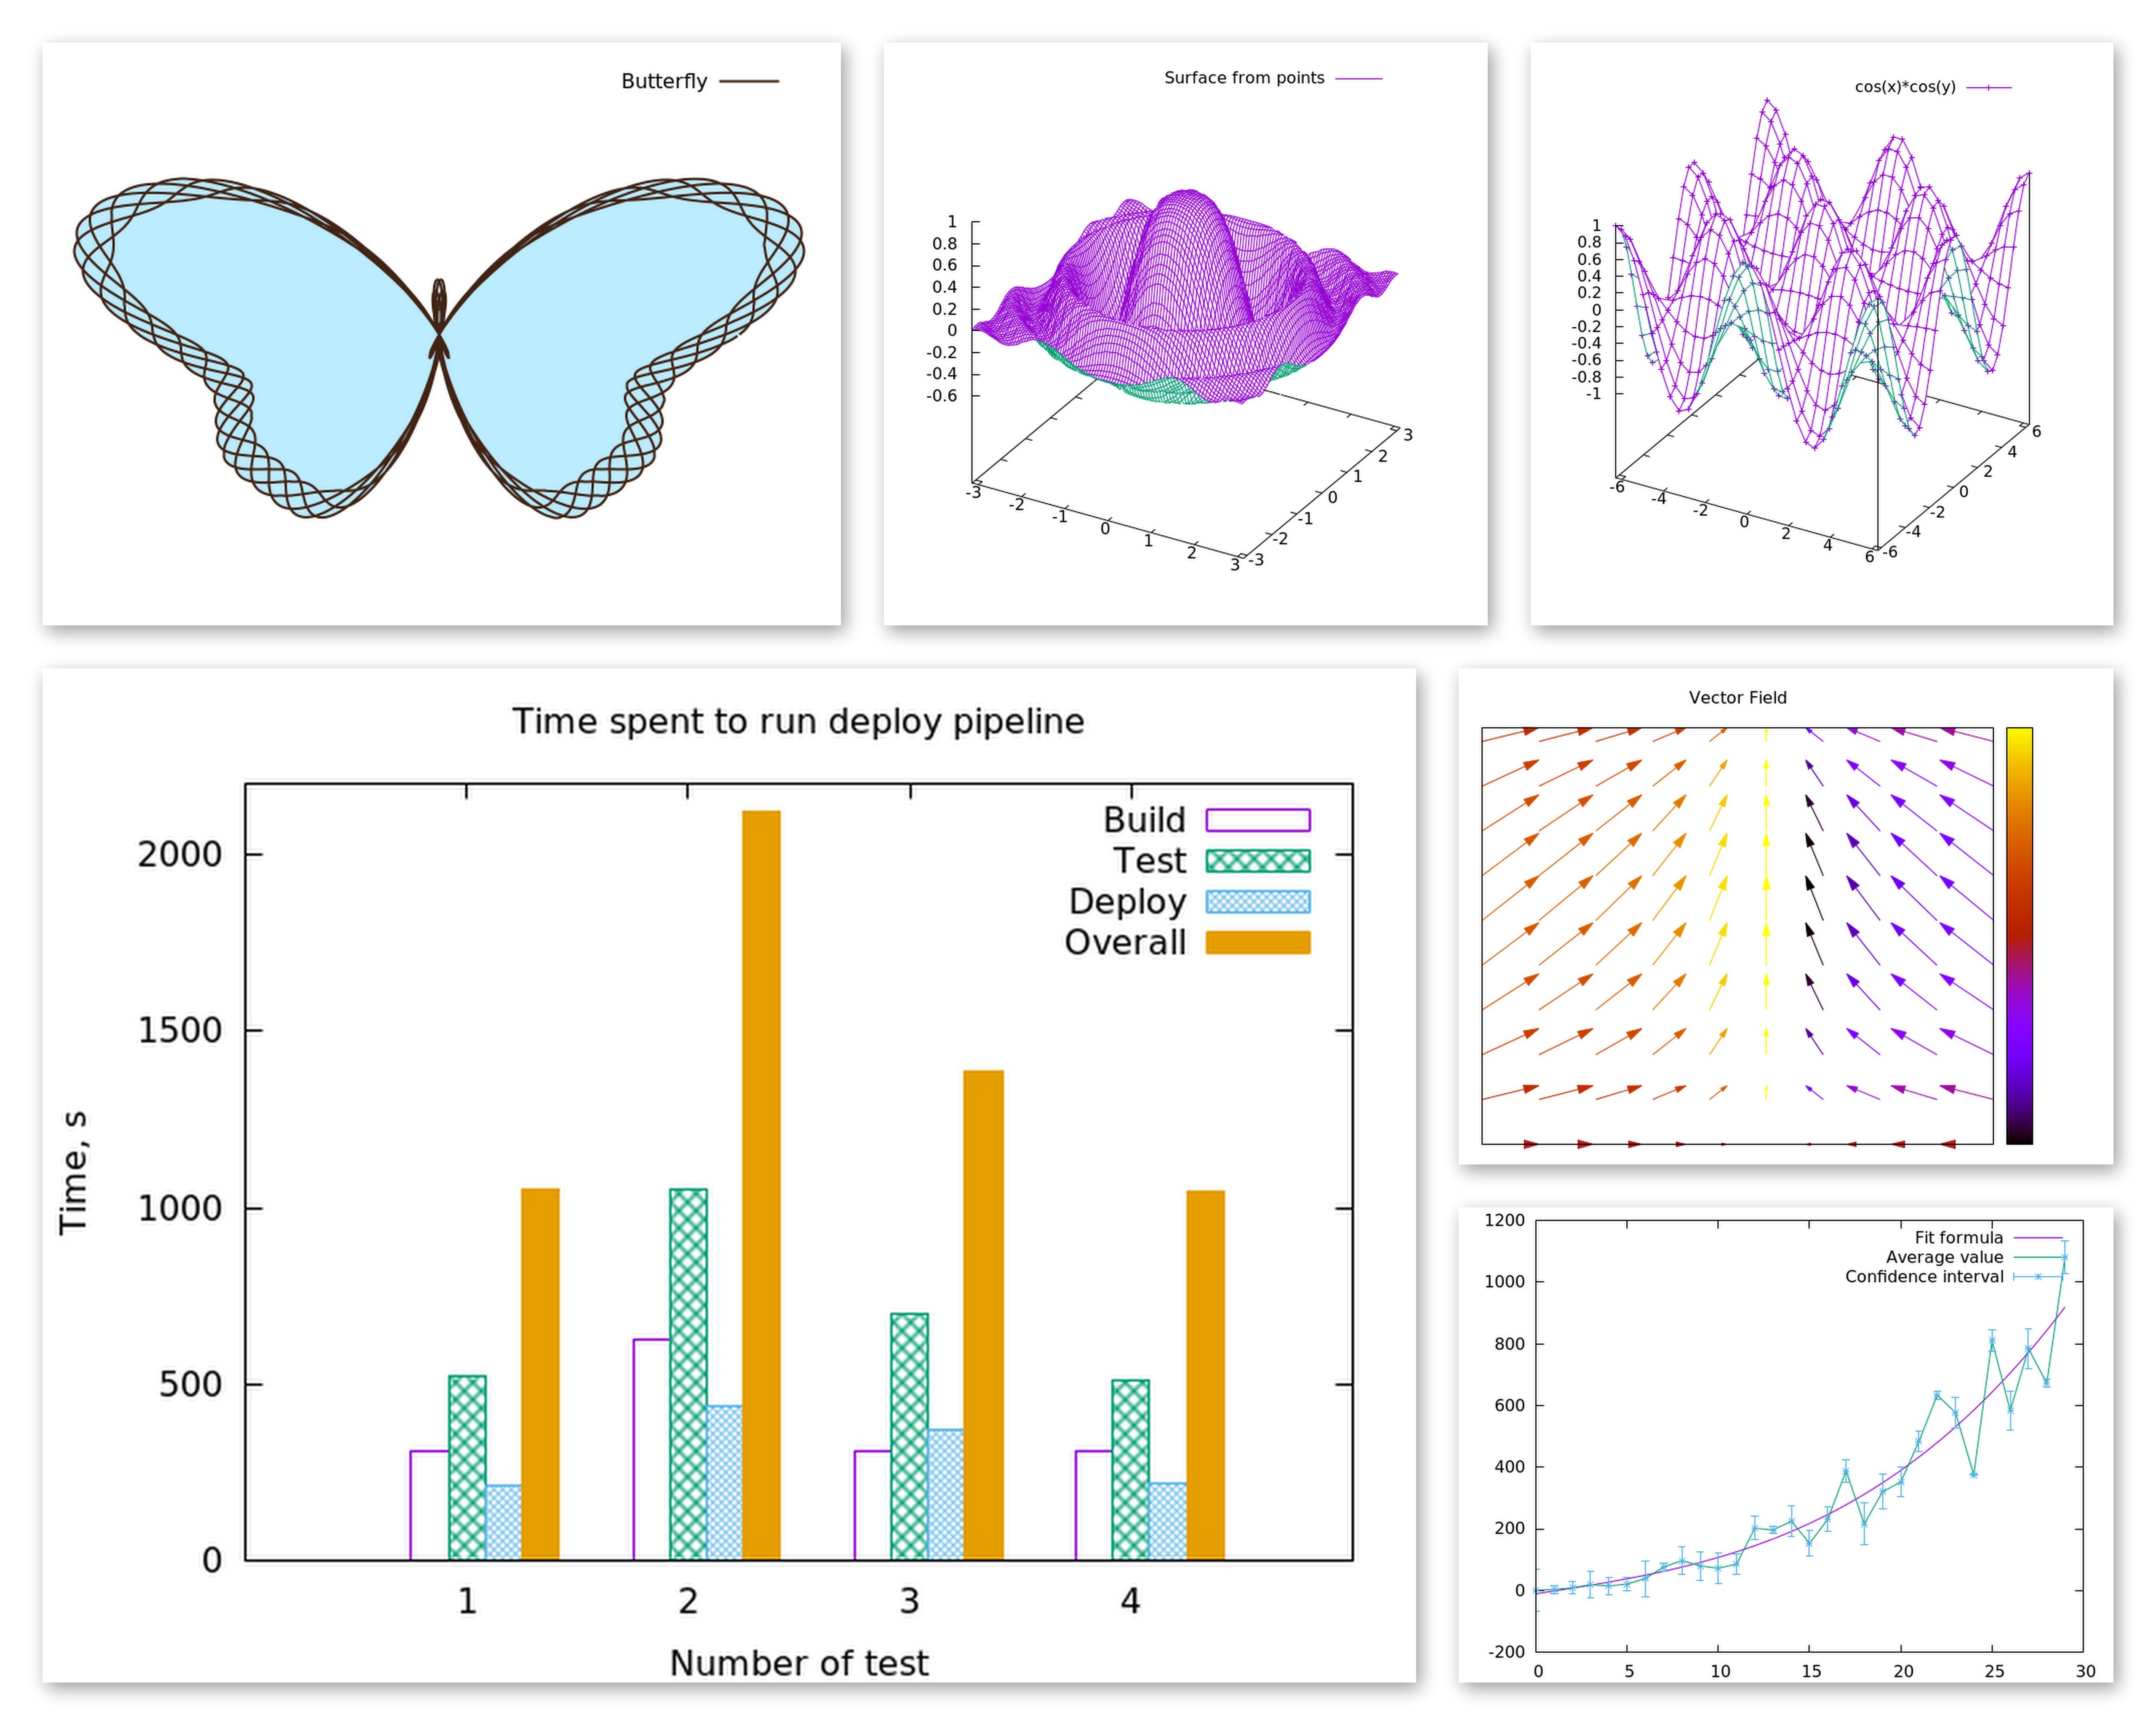
For code examples please see the repository README, notebooks and the examples folder.
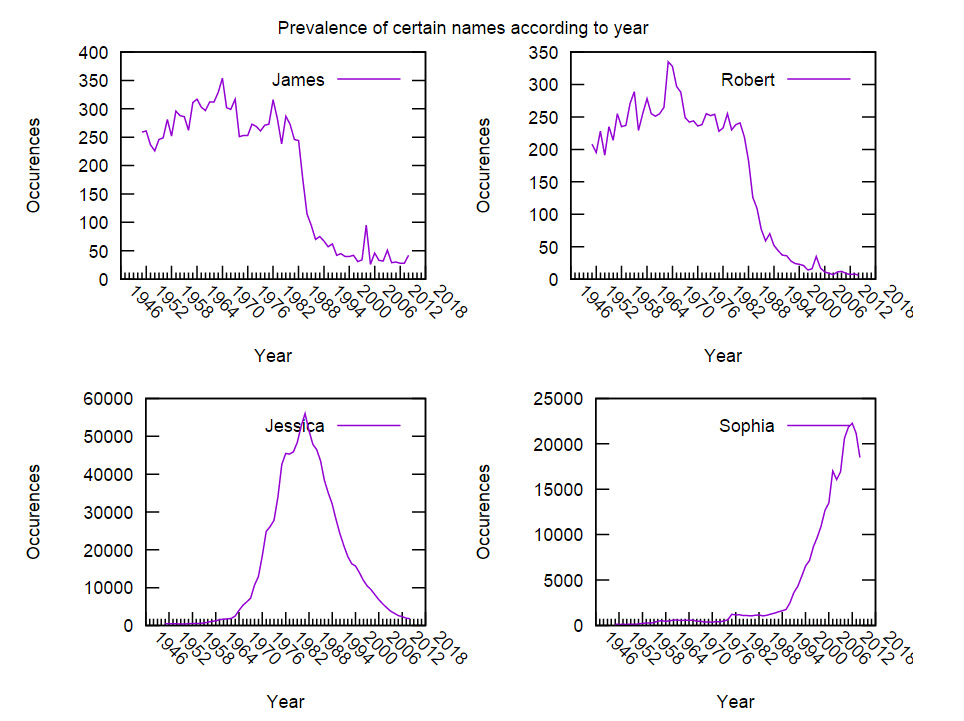
Multiplot
GnuplotRB::Multiplot allows users to place several plots on a single layout and output
them at once (e.g., to a PNG file).
Multiplot notebook.
Here is a multiplot example (taken from Sameer’s notebook):
Animated plots
GnuplotRB may output any plot to gif file but GnuplotRB::Animation allows
to make this gif animated. It takes several Plot or Splot objects just as
multiplot does and outputs them one-by-one as frames of gif animation.
Animation notebook.
Fit
Although the main GnuplotRB’s purpose is to provide you with swift, robust and
easy-to-use plotting tool, it also offers a Fit module that contains several
methods for fitting given data with a function. See examples in Fit notebook.
Integration with other SciRuby tools
Embedding plots into iRuby notebooks
GnuplotRB plots may be embedded into iRuby notebooks as JPEG/PNG/SVG
images, as ASCII art or GIF animations (Animation class). This functionality
explained in a special iRuby notebook.
Using data from Daru containers
To link GnuplotRB with other SciRuby tools I implemented plot
creation from data given in Daru containers (Daru::Dataframe and Daru::Vector).
One can use daru gem in order to work with statistical SciRuby gems
and plotting with GnuplotRB. Notebooks with examples: 1, 2.
Possible datasources for plots
You can pass to Plot (or Splot or Dataset) constructor data in the following forms:
- String containing mathematical formula (e.g.,
'sin(x)') - String containing name of file with data (e.g.,
'points.data') - Some Ruby object responding to
#to_gnuplot_pointsArrayDaru::DataframeDaru::Vector
See examples in notebooks.